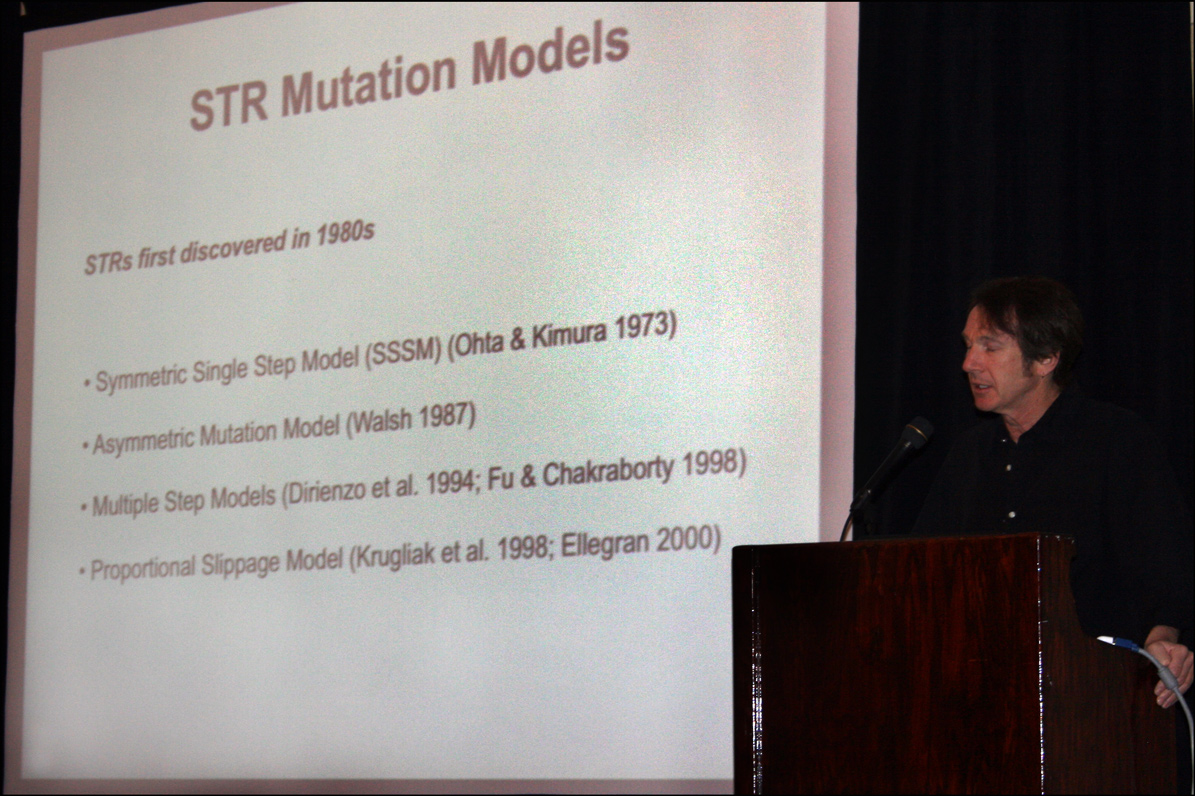
At the recent Family Tree DNA 5th International Conference on Genetic Genealogy for Project Administrators, Dr. Michael Hammer of the University of Arizona discussed advances in calculating the time to the most recent common ancestor (TMRCA).
Michael Hammer, PhD
SOURCE: Michael Hammer, PhD (Houston, Harris County, Texas). Photographed by Stephen J. Danko on 15 March 2009.
Microsatellites or short tandem repeats (STRs) in DNA were first discovered in the 1980s. Genetic genealogists compare the lengths of these STRs present in the Y-chromosome of two individuals in order to estimate the TMRCA.
Several models have been developed over the years to estimate the TMRCA:
- The Symmetric Single Step Model (Ohta T. and M. Kimura, 1973 A model of mutation appropriate to estimate the number of electrophoretically detectable alleles in a genetic population. Genet. Res. 22:201-204.)
- The Asymmetric Mutation Model (Walsh J.B., 1987 Persistence of tandem arrays: implications for satellite and simple-sequence DNAs. Genetics 115:553-567.)
- Multiple Step Models (DiRienzo A., A.C. Peterson, J.C. Garza, A.M. Valdes, M. Statkin et al., 1994 Mutational processes of simple-sequence repeat loci in human populations. Proc. Natl. Acad. Sci. USA 91:3166-3170; Fu Y.-X., and R. Chakraborty, 1998 Simultaneous estimation of all the parameters of a stepwise mutation model. Genetics 150:487-497.)
- The Proportional Slippage Model (Kruglyak S., R. Durrett, M.D. Schug, and C.F. Aquadro, 1998 Equilibrium distributions of microsatellite repeat length resulting from a balance between slippage events and point mutations. Proc. Natl. Acad. Sci. USA 95:10774-10778; Ellegren H., 2000 Microsatellite mutations in the genome: implications for evolutionary inference. Trends Genet. 16:551-555)
Different STRs mutate at different rates, and different lengths of STRs mutate at different rates. In general, the longer the STR, the faster the mutation rate.
Watkins’ Geometric Geometric Model uses four parameters to estimate TMRCA:
- STRs mutate with the probability μ
- STRs mutate up or down with the probability Ï
- STRs mutate in multisteps with the probability α
- STRs mutate with allele-specific mutations with the probability β
When provided with defined pedigrees and STR data, genetic genealogists attempt to calculate the values of μ, Ï, α, and β that are most likely.
Mike Hammer described a method to estimate these parameters for single copy STRs by measuring the number of mutations for each STR and calculating the mutation rate μ for each STR. More mutations are recovered from STRs with more meioses. Close relatives help estimate the α parameter.
These four parameters can be calculated for each STR. In the panels of Y chromosome markers offered by Family Tree DNA, there are both fast and slow changing markers. Panel #2, as a whole, is faster moving than Panel #1, and Panel #3, in general, is faster moving than Panel #2.
The calculation of TMRCA will continue to be refined as more data is collected.
See Watkins J.C. 2007 Microsatellite evolution: Markov transition functions for a suite of models. Theor. Popul. Biol. 71:147-159 for a more detailed discussion of models of STR mutation rates.
Copyright © 2009 by Stephen J. Danko


OK, how about one more time in plain English for those of us who are scientifically challenged? I truly would love to be able to understand how DNA and mtDNA testing applies to genealogists. I know what DNA and mtDNA basically is and I understand most of the charts and I think I know what the most recent common ancestor is. It’s understanding the test results and comparing them with others results that give me the most headaches.
> Watkins’ Geometric Geometric Model uses four parameters to estimate TMRCA:
* STRs mutate with the probability ?
* STRs mutate up or down with the probability ?
* STRs mutate in multisteps with the probability ?
* STRs mutate with allele-specific mutations with the probability ?
There should be a 5th parameter, describing how far a particular marker’s repeat value, in a specific Y-chromosome of a specific terminal haplogroup, is from the mean repeat value of that marker averaged over all Y-chromosomes of exactly the same specific terminal haplogroup. If a marker has a repeat value further from its mean (= most stable) value a mutation is more likely to occur.